News Source
Dr. Jenica M. Allen, Assistant Professor, University of New Hampshire
Species ranges are one attribute that can be altered by climate change. The geographic limits of where you find a species and where you don’t are determined by the species’ biology, specifically in what climatic conditions can it survive (Figure 1). For some species, that’s warm and dry climates, for others it’s cool and wet, or one of many combinations of temperature and precipitation. Where a species’ range margin might contract and where it might expand in the future depend on how the suitable climate moves on a map for any given species. Knowing where a species can survive is the first step to managing invasion impacts.
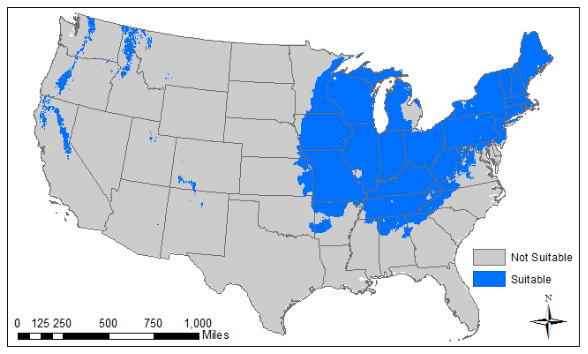
Figure 1. Species range maps indicate suitable and unsuitable areas based on the species’ biology.
Invasive Plant Distribution Models and Climate Change
Species distribution models are quantitative representations of species-climate relationships (Figure 2). At regional to continental scales, distribution models can produce maps of where a species is likely to occur. Such maps based on future climate are useful for highlighting areas where a species might expand its range, and areas that might become climatically unsuitable for the species. Range maps for many species can be overlaid to estimate species richness. In the case of invasive species, high species richness is another way to measure invasion risk. More species, more potential problems.
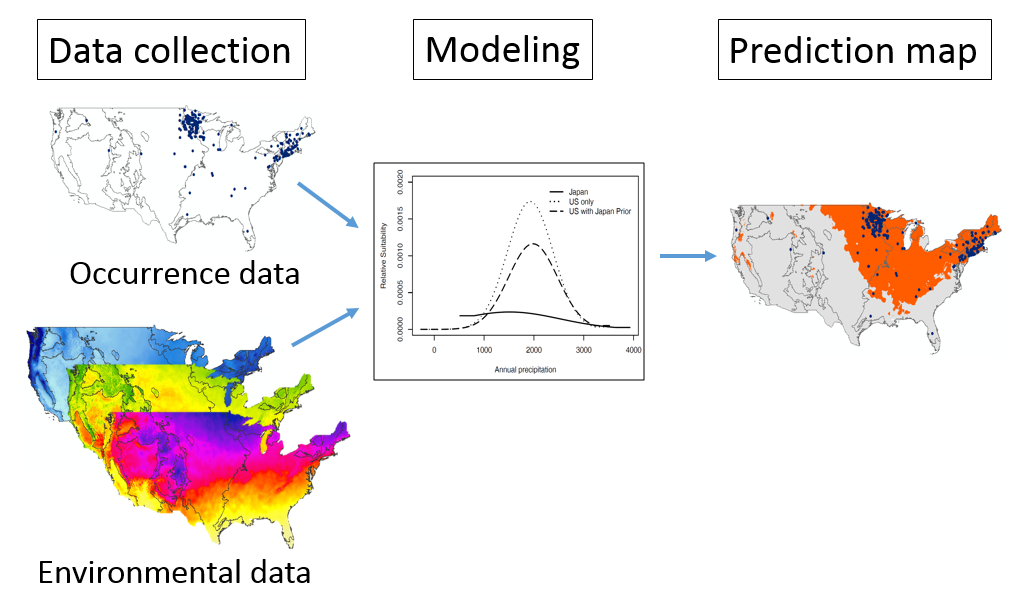
Figure 2. Conceptual diagram of how data are used in modeling to produce a species distribution map.
In recent work published in Biological Conservation (get it here), we used distribution modeling for nearly 900 terrestrial invasive plants in the continental United States to estimate the geography of invasion risk with climate change. That’s a lot of species, but actually only includes invasive species that are already present in the U.S. Using the relationships discovered between climate and each species’ geographic locations, we projected future ranges based on climate from 13 general circulation models (GCMs) for mid-century (2050) under Representative Concentration Pathway (RCP) 4.5.
GCMs are models that characterize the exchange of energy and matter between the earth’s surface and the atmosphere and between different components of the atmosphere, where each GCM represents complex processes in different ways. No one model is correct for all climate characteristics in all parts of the world, so we typically use many to bracket the range of future possible changes in climate. If projections from many models agree, we have higher confidence that the projected event will occur.
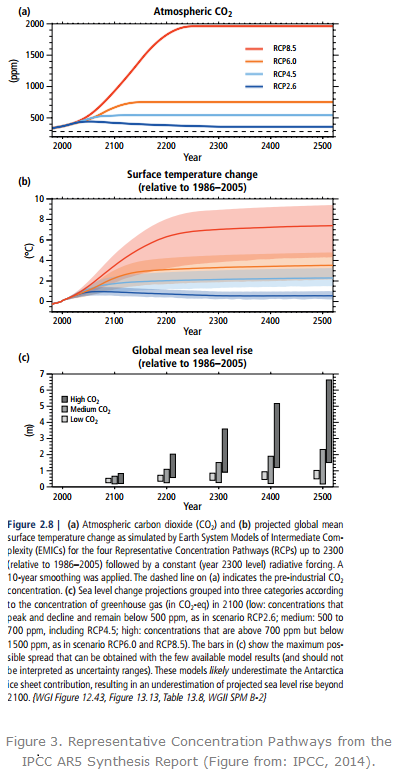
RCPs are greenhouse gas concentration trajectories established by the International Panel on Climate Change (IPCC) that represent possible future radiative forcing scenarios (Collins et al., 2013). Each RCP has an associated set of greenhouse gas concentrations over time (Figure 3a), which leads to an expected change in temperature over time (Figure 3b). We don’t know exactly how the social, economic, and political factors that dictate greenhouse gas concentrations will unfold in the future, so we need a set of reasonable representative possibilities. RCP 4.5 is an intermediate scenario among the four RCPs in the most recent IPCC report.
Reduced Future Invasion Risk?
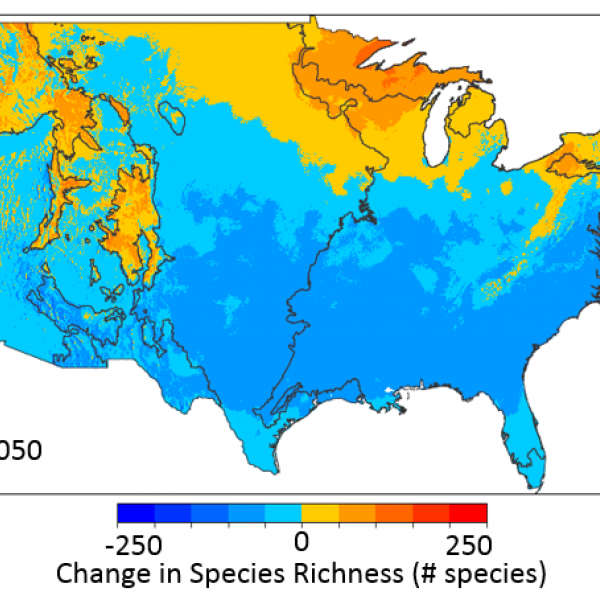
The surprise in our analysis was that invasive species richness was expected to decrease across many areas of the continental U.S. by mid-century (Figure 4). That sounds like great news, but there are still a few downsides.
First, our analysis focused on invasive plants that are already present in the continental U.S. and invasion pressure for new (potential) invasive plants remains high. High invasion pressure comes especially from areas that are climatically similar to the areas that might lose invasive plants in our analysis (Bradley et al., 2012). Without strong prevention measures in place, we could simply be priming the country for a new wave of invasive species.
Second, higher latitude and mountainous areas are expected to gain invasive plant species. So while many areas may experience fewer impacts from our current pool of invasive plants, northern parts of the country could accumulate problems.
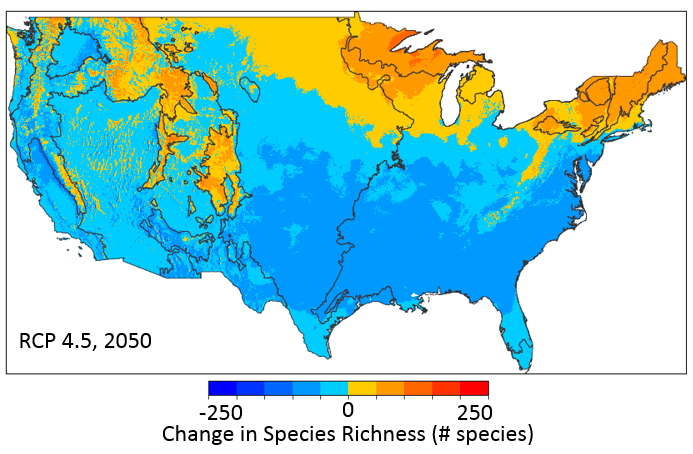
Figure 4. Future changes in potential terrestrial invasive plant richness show considerably lower invasion risk with climate change across much of the continental U.S. Estimates are based on a 13-model ensemble richness mean for mid-century (2050) under RCP 4.5 at 5 km resolution. All maps represent numbers of species at 5 km resolution and black lines delineate CEC level I ecoregions.
All is not lost though, and these range shifts could actually still have conservation benefit if proactive containment actions are taken. The future range models can be used to identify species likely to expand into new regions. Since the models are prospective, containment programs can be put in place to restrict the spread into newly suitable areas. By highlighting potential for future invasion, geographical analyses can inform state-level watch lists and management prioritization in light of climate change.
Watch Lists: New York State Example
Invasive species watch lists can include plants that are not currently in a state, but that could establish there now or, in the context of this article, in the future with changed environments. We applied the following criteria to the range maps produced from our analysis in order to include a species on the New York State watch list:
- Species is not on the current state invasive plant list or federal noxious weed list.
- Species has not been observed in the state
- Current climate model does not predict occurrence in the state
- At least 85% agreement among climate change models that the species will have suitable climate in the state by 2050 under RCP 4.5.
Thirty-four species were identified as potential range expanders into New York State with climate change by mid-century (Table 1). Of those 34 species, 35% (12 species) are present in nearby states (bold in Table 1) and are the species most likely to establish new populations in New York State by 2050. Get the full report here.
This preliminary analysis highlights the utility of geographic modeling for informing state-level watch lists of invasive species. Our methods are a starting point for how species could be prioritized geographically. But, these geographical decisions need to be refined with input of invasive species managers. For example, our current list includes only species absent from New York State, but we could instead choose to include species present in only a small portion of the state and expanding with climate change. Additionally, geographic analyses could be combined with an evaluation of invasive species impact (e.g., via literature reviews using consistent metrics of impact such as the new EICAT framework; Hawkins et al., 2015) and information about likelihood of species dispersal into New York State in order to improve species prioritization. This watch list provides an important illustration of how geographic modeling can inform invasive species prioritization.
Table 1: Invasive plant species likely to expand their range into New York State by 2050 with climate change. Species in bold are already present in nearby states.
| Scientific Name | Common Name | USDA Code | Growth Form |
|---|---|---|---|
| Araujia sericifera | white bladderflower | ARSE8 | vine |
| Ardisia elliptica | shoebutton | AREL4 | shrub, tree |
| Arundo donax | giant reed | ARDO4 | graminoid, shrub, subshrub |
| Asclepias curassavica | bloodflower | ASCU | forb/herb, subshrub |
| Avena barbata | slender oat | AVBA | graminoid |
| Bellardia trixago | Mediterranean linseed | BETR | forb/herb |
| Brachypodium distachyon | purple false brome | BRDI2 | graminoid |
| Buddleja lindleyana | Lindley’s butterflybush | BULI | shrub |
| Canna indica | indian shot | CAIN19 | forb/herb |
| Carthamus lanatus | woolly distaff thistle | CALA20 | forb/herb |
| Cestrum diurnum | day jessamine | CEDI6 | shrub/tree |
| Conyza bonariensis | asthmaweed | COBO | forb/herb |
| Cortaderia selloana | Uraguayan pampas grass | COSE4 | graminoid |
| Crotalaria spectabilis | showy rattlebox | CRSP2 | forb/herb |
| Ehrharta erecta | panic veldtgrass | EHER | graminoid |
| Firmiana simplex | Chinese parasoltree | FISI2 | shrub, tree |
| Hedera helix spp. canariensis | Algerian ivy | HEHEC | vine |
| Hemarthria altissima | limpograss | HEAL5 | graminoid |
| Hibiscus tiliaceus | sea hibiscus | HITI | shrub, tree |
| Jasminum multiflorum | star jasmine | JAMU2 | shrub, vine |
| Lagerstroemia indica | crapemyrtl | LAIN | shrub, tree |
| Ligustrum japonicum | Japanese privet | LIJA | shrub, tree |
| Liriope spicata | creeping liriope | LISP10 | forb/herb |
| Mosla dianthera | miniature beefsteakplant | MODI4 | forb/herb |
| Nandina domestica | sacred bamboo | NADO | shrub |
| Nerium oleander | oleander | NEOL | |
| Paspalum urvillei | Vasey’s grass | PAUR2 | graminoid |
| Peganum harmala | harmal peganum | PEHA | forb/herb |
| Persea americana | avocado | PEAM3 | tree |
| Phyllanthus tenellus | Mascarene Island leaf-flower | PHTE5 | forb/herb |
| Polypogon viridis | beardless rabbitsfoot | POVI9 | graminoid |
| Sesbania punicea | rattlebox | SEPU7 | forb/herb, subshrub |
| Tamarix aphylla | Athel tamarisk | TAAP | shrub, tree |
| Tamarix chinensis | five-stamen tamarisk | TACH2 | shrub, tree |
Literature Cited
Allen, J.M., Bradley, B.A. (2016). Out of the weeds? Reduced plant invasion risk with climate change in the continental United States. Biological Conservation, 203, 306-312.
Bradley, B.A., Blumenthal, D.M., Early, R., Grosholz, E.D., Lawler, J.J., Miller, L.P., Sorte, C.J., D’Antonio, C.M., Diez, J.M., Dukes, J.S., Ibanez, I., Olden, J.D. (2012). Global change, global trade, and the next wave of plant invasions. Frontiers in Ecology and the Environment, 10, 20–28.
Collins, M., Knutti, R., Arblaster, J., Dufresne, J.-L., Fichefet, T., Friedlingstein, P., Gao, X., Gutowski, W.J., Johns, T., Krinner, G., Shongwe, M., Tebaldi, C., Weaver, A.J., Wehner, M. (2013). Long-term climate change: Projections, commitments and irreversibility, in: Stocker, T.., Qin, D., Plattner, G.-K., Tignor, M., Allen, S.K., Boschung, J., Nauels, A., Xia, Y., Bex, V., Midgley, P.M. (Eds.), Climate Change 2013: The Physical Science Basis. Contribution of Working Group I to the Fifth Assessment Report of the Intergovernmental Panel on Climate Change. Cambridge University Press, New York, NY, pp. 1029–1136.
Commission for Environmental Cooperation (CEC) (1997). Ecological Regions of North America, Commission for Environmental Cooperation, Montreal. 60pp.
Hawkins, C.L., Bacher, S., Essl, F., Hulme, P.E., Jeschke, J.M., Kühn, I., Kumschick, S., Nentwig, W., Pergl, J., Pyšek, P., Rabitsch, W., Richardson, D.M., Vilà, M., Wilson, J.R.U., Genovesi, P., Blackburn, T.M. (2015). Framework and guidelines for implementing the proposed IUCN Environmental Impact Classification for Alien Taxa (EICAT). Diversity and Distributions, 21, 1360–1363.
IPCC (2014). Climate Change 2014: Synthesis Report. Contribution of Working Groups I, II, and III to the Fifth Assessment Report of the Intergovernmental Panel on Climate Change. Core Writing Team, Pachauri, R.K., Meyer, L.A. (eds.). IPCC, Geneva, Switzerland, 151 pp.